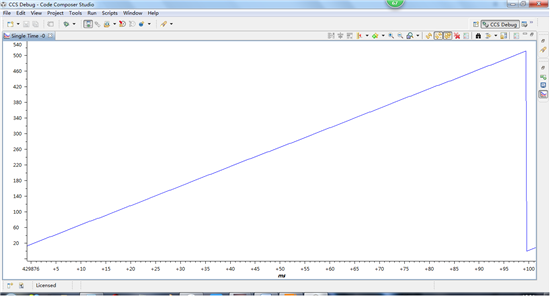
利用Graph画Single Time图
运行的算法是SPWM,5K的timer算法中断(PWM波频率)
程序里把360度电角度细分为512份存到一个数组里,利用查表得方式查角度,索引变量明是index
也就是如果用观测这个变量的波形应该是锯齿波,周期性从0到511.
我在代码里设置了一个512的数组,每200us进入算法中断王这个数组里存储一个index值。
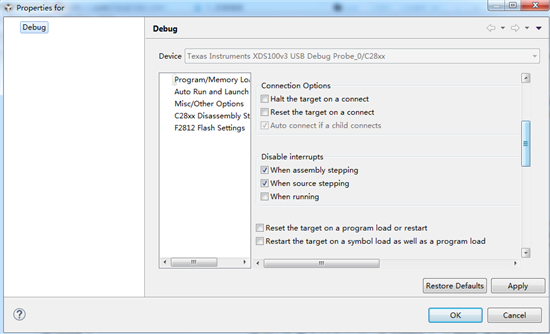
Graph的设置如下:
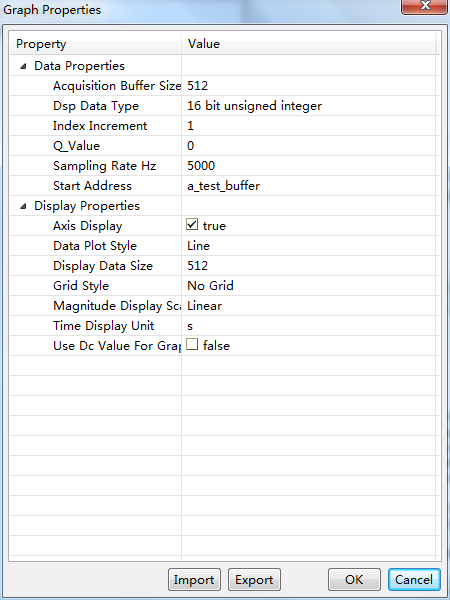
1.Acquisition Buffer Size 和 Display Data Size都设置为512
Acquisition Buffer 设置为512 是依据help里的“This is the size of the acquisition buffer you are using on your actual/simulated target board.”
代码里的设置的数组是512,所以这个buffer的大小也就设置为512了。
Display Data Size也设置为512,是依据“If your program processes an entire frame at one time (more than one sample) and you are only interested in that frame, enter the same value in the Acquisition Buffer Size and the Display Data Size fields. ”
但是help里的 Left-Shifted Data Display在哪里使能和关闭没有找到???
2.对于Sampling Rate (Hz)设置为5000,是依据“The axis is labeled from 0 to (Display Data Size * 1/Sampling Rate).” 我的代码里是每隔0.0002秒即200us存一个数据,数组大小是512,所以经过512*0.0002=0.1024秒数组存满,所以我把时间轴设置为0到512/5000(sample rate)=0.1024秒的范围
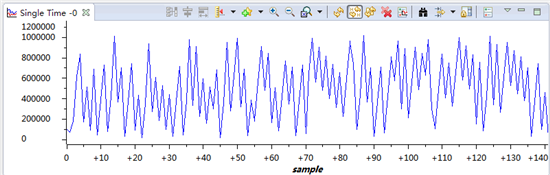
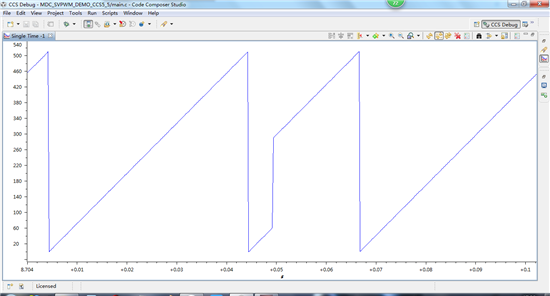
观测到的波形图如下:
请问:
为什么会有不连续的部分呢?
我验证了一个完整周期的正确性:
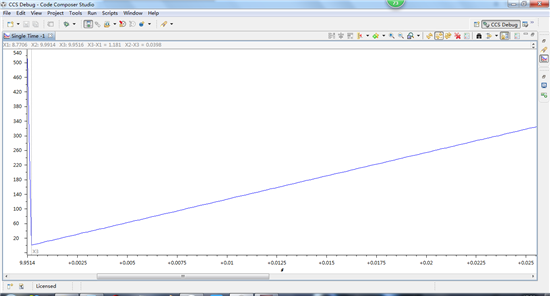
如上图,时间轴设置了另个节点,电角度转过360所用的时间为X2-X3=0.0398s
我的鼠笼机是2对极的
所以360度电角度对应180度机械角度,对应0.5rpm
极同步磁场的旋转速度为(0.5/0.0398)x 60 = 753.7rpm
我的转速设置为750rpm,由此可以看出,完整周期下的波形应该是正确的,大家看看不规则的波形是怎么造成的呢 谢谢!
mangui zhang:
Acquisition Buffer设为1看看
利用Graph画Single Time图
运行的算法是SPWM,5K的timer算法中断(PWM波频率)
程序里把360度电角度细分为512份存到一个数组里,利用查表得方式查角度,索引变量明是index
也就是如果用观测这个变量的波形应该是锯齿波,周期性从0到511.
我在代码里设置了一个512的数组,每200us进入算法中断王这个数组里存储一个index值。
Graph的设置如下:
1.Acquisition Buffer Size 和 Display Data Size都设置为512
Acquisition Buffer 设置为512 是依据help里的“This is the size of the acquisition buffer you are using on your actual/simulated target board.”
代码里的设置的数组是512,所以这个buffer的大小也就设置为512了。
Display Data Size也设置为512,是依据“If your program processes an entire frame at one time (more than one sample) and you are only interested in that frame, enter the same value in the Acquisition Buffer Size and the Display Data Size fields. ”
但是help里的 Left-Shifted Data Display在哪里使能和关闭没有找到???
2.对于Sampling Rate (Hz)设置为5000,是依据“The axis is labeled from 0 to (Display Data Size * 1/Sampling Rate).” 我的代码里是每隔0.0002秒即200us存一个数据,数组大小是512,所以经过512*0.0002=0.1024秒数组存满,所以我把时间轴设置为0到512/5000(sample rate)=0.1024秒的范围
观测到的波形图如下:
请问:
为什么会有不连续的部分呢?
我验证了一个完整周期的正确性:
如上图,时间轴设置了另个节点,电角度转过360所用的时间为X2-X3=0.0398s
我的鼠笼机是2对极的
所以360度电角度对应180度机械角度,对应0.5rpm
极同步磁场的旋转速度为(0.5/0.0398)x 60 = 753.7rpm
我的转速设置为750rpm,由此可以看出,完整周期下的波形应该是正确的,大家看看不规则的波形是怎么造成的呢 谢谢!
user78960159:
之前发的帖子点了发送 从个人帐号的记录里能看到 但是在论坛看不到,记录里点进去显示的无资源,不明原因
重发!!!!!!!!!!!!!!!!!!!
首先Acquisition Buffer Size设置为512是没有问题的,因为硬件上确实是有个512的数组;
其次Display Data Size也设置为512,是依据“If your program processes an entire frame at one time (more than one sample) and you are only interested in that frame, enter the same value in the Acquisition Buffer Size and the Display Data Size fields. ”这个设置也问题
希望观测0.1024S的数据 timer周期为200us 进512次中断,每进一次更新一个buffer的数值,这样算下来0.1024秒电机转过360度电角度,我的电机是2极的 对应的转速为(0.5/0.1024)* 60 = 292.96875 约为293转 我之前的转速设置为750转。
将转速更改为293rpm后,0.1024的锯齿波就出来了
写的有些简单 之前那个帖子写的清楚些,但是发完再想点进去看就显示找不到资源,不知道为什么,建议论坛建设的时候注意下,不要总出现这种问题。
截取的软件波形和示波器波形如下图:
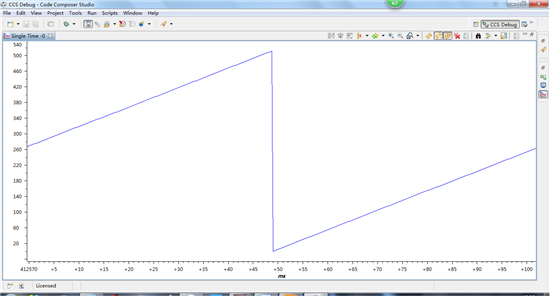
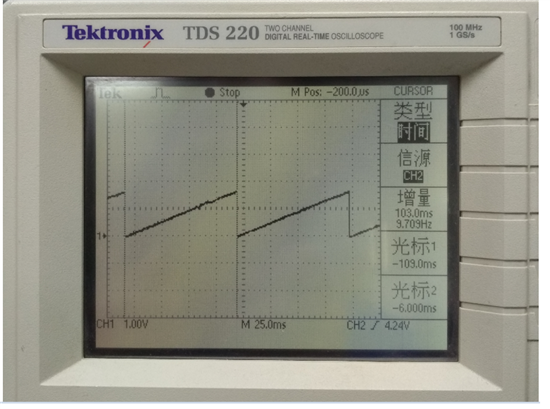
示波器波形由硬件DA截取 2812的SPI口挂了一个DA
利用Graph画Single Time图
运行的算法是SPWM,5K的timer算法中断(PWM波频率)
程序里把360度电角度细分为512份存到一个数组里,利用查表得方式查角度,索引变量明是index
也就是如果用观测这个变量的波形应该是锯齿波,周期性从0到511.
我在代码里设置了一个512的数组,每200us进入算法中断王这个数组里存储一个index值。
Graph的设置如下:
1.Acquisition Buffer Size 和 Display Data Size都设置为512
Acquisition Buffer 设置为512 是依据help里的“This is the size of the acquisition buffer you are using on your actual/simulated target board.”
代码里的设置的数组是512,所以这个buffer的大小也就设置为512了。
Display Data Size也设置为512,是依据“If your program processes an entire frame at one time (more than one sample) and you are only interested in that frame, enter the same value in the Acquisition Buffer Size and the Display Data Size fields. ”
但是help里的 Left-Shifted Data Display在哪里使能和关闭没有找到???
2.对于Sampling Rate (Hz)设置为5000,是依据“The axis is labeled from 0 to (Display Data Size * 1/Sampling Rate).” 我的代码里是每隔0.0002秒即200us存一个数据,数组大小是512,所以经过512*0.0002=0.1024秒数组存满,所以我把时间轴设置为0到512/5000(sample rate)=0.1024秒的范围
观测到的波形图如下:
请问:
为什么会有不连续的部分呢?
我验证了一个完整周期的正确性:
如上图,时间轴设置了另个节点,电角度转过360所用的时间为X2-X3=0.0398s
我的鼠笼机是2对极的
所以360度电角度对应180度机械角度,对应0.5rpm
极同步磁场的旋转速度为(0.5/0.0398)x 60 = 753.7rpm
我的转速设置为750rpm,由此可以看出,完整周期下的波形应该是正确的,大家看看不规则的波形是怎么造成的呢 谢谢!
user78960159:
之前发的帖子刚又看到了 在是否解决问题的地方 点了一下“是” 发的帖子就不见了
是说自己发的帖子自己不能解答吗
利用Graph画Single Time图
运行的算法是SPWM,5K的timer算法中断(PWM波频率)
程序里把360度电角度细分为512份存到一个数组里,利用查表得方式查角度,索引变量明是index
也就是如果用观测这个变量的波形应该是锯齿波,周期性从0到511.
我在代码里设置了一个512的数组,每200us进入算法中断王这个数组里存储一个index值。
Graph的设置如下:
1.Acquisition Buffer Size 和 Display Data Size都设置为512
Acquisition Buffer 设置为512 是依据help里的“This is the size of the acquisition buffer you are using on your actual/simulated target board.”
代码里的设置的数组是512,所以这个buffer的大小也就设置为512了。
Display Data Size也设置为512,是依据“If your program processes an entire frame at one time (more than one sample) and you are only interested in that frame, enter the same value in the Acquisition Buffer Size and the Display Data Size fields. ”
但是help里的 Left-Shifted Data Display在哪里使能和关闭没有找到???
2.对于Sampling Rate (Hz)设置为5000,是依据“The axis is labeled from 0 to (Display Data Size * 1/Sampling Rate).” 我的代码里是每隔0.0002秒即200us存一个数据,数组大小是512,所以经过512*0.0002=0.1024秒数组存满,所以我把时间轴设置为0到512/5000(sample rate)=0.1024秒的范围
观测到的波形图如下:
请问:
为什么会有不连续的部分呢?
我验证了一个完整周期的正确性:
如上图,时间轴设置了另个节点,电角度转过360所用的时间为X2-X3=0.0398s
我的鼠笼机是2对极的
所以360度电角度对应180度机械角度,对应0.5rpm
极同步磁场的旋转速度为(0.5/0.0398)x 60 = 753.7rpm
我的转速设置为750rpm,由此可以看出,完整周期下的波形应该是正确的,大家看看不规则的波形是怎么造成的呢 谢谢!
Eric Ma:
回复 user78960159:
自己的帖子当然可以自己回答。
ERIC
利用Graph画Single Time图
运行的算法是SPWM,5K的timer算法中断(PWM波频率)
程序里把360度电角度细分为512份存到一个数组里,利用查表得方式查角度,索引变量明是index
也就是如果用观测这个变量的波形应该是锯齿波,周期性从0到511.
我在代码里设置了一个512的数组,每200us进入算法中断王这个数组里存储一个index值。
Graph的设置如下:
1.Acquisition Buffer Size 和 Display Data Size都设置为512
Acquisition Buffer 设置为512 是依据help里的“This is the size of the acquisition buffer you are using on your actual/simulated target board.”
代码里的设置的数组是512,所以这个buffer的大小也就设置为512了。
Display Data Size也设置为512,是依据“If your program processes an entire frame at one time (more than one sample) and you are only interested in that frame, enter the same value in the Acquisition Buffer Size and the Display Data Size fields. ”
但是help里的 Left-Shifted Data Display在哪里使能和关闭没有找到???
2.对于Sampling Rate (Hz)设置为5000,是依据“The axis is labeled from 0 to (Display Data Size * 1/Sampling Rate).” 我的代码里是每隔0.0002秒即200us存一个数据,数组大小是512,所以经过512*0.0002=0.1024秒数组存满,所以我把时间轴设置为0到512/5000(sample rate)=0.1024秒的范围
观测到的波形图如下:
请问:
为什么会有不连续的部分呢?
我验证了一个完整周期的正确性:
如上图,时间轴设置了另个节点,电角度转过360所用的时间为X2-X3=0.0398s
我的鼠笼机是2对极的
所以360度电角度对应180度机械角度,对应0.5rpm
极同步磁场的旋转速度为(0.5/0.0398)x 60 = 753.7rpm
我的转速设置为750rpm,由此可以看出,完整周期下的波形应该是正确的,大家看看不规则的波形是怎么造成的呢 谢谢!
user78960159:
回复 Eric Ma:
好的 谢谢您的解答
利用Graph画Single Time图
运行的算法是SPWM,5K的timer算法中断(PWM波频率)
程序里把360度电角度细分为512份存到一个数组里,利用查表得方式查角度,索引变量明是index
也就是如果用观测这个变量的波形应该是锯齿波,周期性从0到511.
我在代码里设置了一个512的数组,每200us进入算法中断王这个数组里存储一个index值。
Graph的设置如下:
1.Acquisition Buffer Size 和 Display Data Size都设置为512
Acquisition Buffer 设置为512 是依据help里的“This is the size of the acquisition buffer you are using on your actual/simulated target board.”
代码里的设置的数组是512,所以这个buffer的大小也就设置为512了。
Display Data Size也设置为512,是依据“If your program processes an entire frame at one time (more than one sample) and you are only interested in that frame, enter the same value in the Acquisition Buffer Size and the Display Data Size fields. ”
但是help里的 Left-Shifted Data Display在哪里使能和关闭没有找到???
2.对于Sampling Rate (Hz)设置为5000,是依据“The axis is labeled from 0 to (Display Data Size * 1/Sampling Rate).” 我的代码里是每隔0.0002秒即200us存一个数据,数组大小是512,所以经过512*0.0002=0.1024秒数组存满,所以我把时间轴设置为0到512/5000(sample rate)=0.1024秒的范围
观测到的波形图如下:
请问:
为什么会有不连续的部分呢?
我验证了一个完整周期的正确性:
如上图,时间轴设置了另个节点,电角度转过360所用的时间为X2-X3=0.0398s
我的鼠笼机是2对极的
所以360度电角度对应180度机械角度,对应0.5rpm
极同步磁场的旋转速度为(0.5/0.0398)x 60 = 753.7rpm
我的转速设置为750rpm,由此可以看出,完整周期下的波形应该是正确的,大家看看不规则的波形是怎么造成的呢 谢谢!
xu zhang11:
回复 user78960159:
您好,请问Graph Window的横坐标代表实际时间吗?
利用Graph画Single Time图
运行的算法是SPWM,5K的timer算法中断(PWM波频率)
程序里把360度电角度细分为512份存到一个数组里,利用查表得方式查角度,索引变量明是index
也就是如果用观测这个变量的波形应该是锯齿波,周期性从0到511.
我在代码里设置了一个512的数组,每200us进入算法中断王这个数组里存储一个index值。
Graph的设置如下:
1.Acquisition Buffer Size 和 Display Data Size都设置为512
Acquisition Buffer 设置为512 是依据help里的“This is the size of the acquisition buffer you are using on your actual/simulated target board.”
代码里的设置的数组是512,所以这个buffer的大小也就设置为512了。
Display Data Size也设置为512,是依据“If your program processes an entire frame at one time (more than one sample) and you are only interested in that frame, enter the same value in the Acquisition Buffer Size and the Display Data Size fields. ”
但是help里的 Left-Shifted Data Display在哪里使能和关闭没有找到???
2.对于Sampling Rate (Hz)设置为5000,是依据“The axis is labeled from 0 to (Display Data Size * 1/Sampling Rate).” 我的代码里是每隔0.0002秒即200us存一个数据,数组大小是512,所以经过512*0.0002=0.1024秒数组存满,所以我把时间轴设置为0到512/5000(sample rate)=0.1024秒的范围
观测到的波形图如下:
请问:
为什么会有不连续的部分呢?
我验证了一个完整周期的正确性:
如上图,时间轴设置了另个节点,电角度转过360所用的时间为X2-X3=0.0398s
我的鼠笼机是2对极的
所以360度电角度对应180度机械角度,对应0.5rpm
极同步磁场的旋转速度为(0.5/0.0398)x 60 = 753.7rpm
我的转速设置为750rpm,由此可以看出,完整周期下的波形应该是正确的,大家看看不规则的波形是怎么造成的呢 谢谢!
xu zhang11:
回复 xu zhang11:
您好,我在Graph Window中进行设置参数时,将横轴选择表示为ms时间轴,不同的采样频率对应的从0度上升到360度对应的横轴时间不一样,这是什么问题呢?
非常感谢!!!