同上,谢谢;
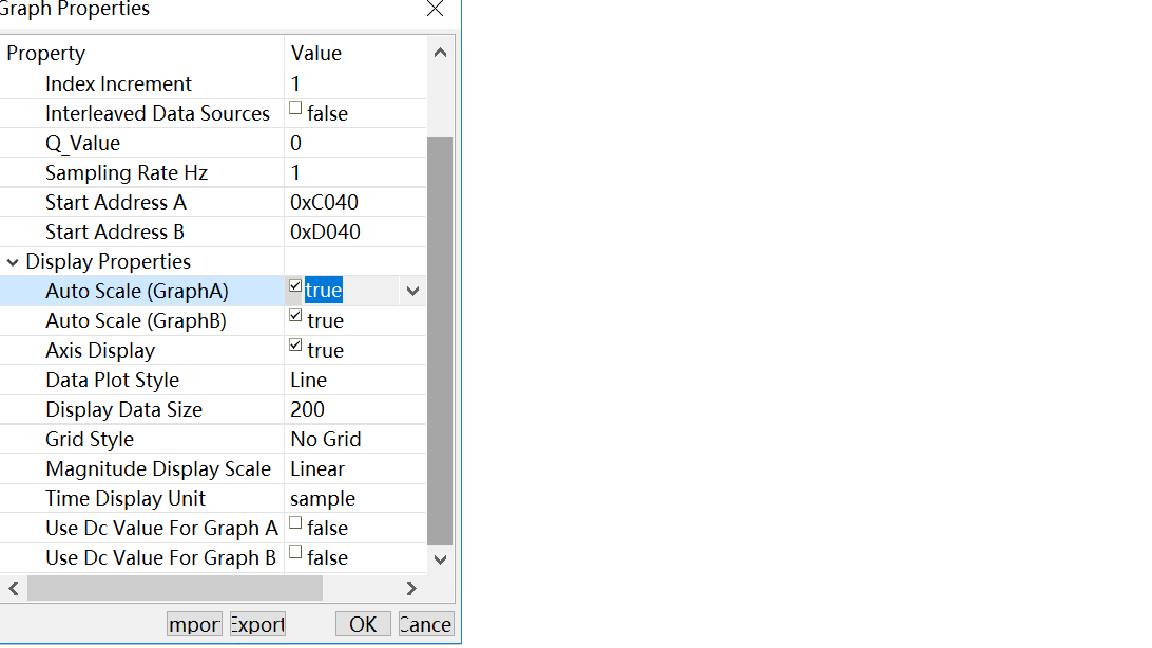
Susan Yang:您可以使用Tools->Graph->Dual Time
This graph plots the data in the display buffer on a magnitude versus time graph with no preprocessing. A dual time trace of signal(s) is displayed on the graph, allowing you to plot two time domain traces in a single graph window.
同上,谢谢;
user5195598:
回复 Susan Yang:
谢谢Susan,
我这样设置了,观察两个数组变量,数组大小一样,使用Dual Time方式后,显示的图形怎么还是在两个图形上,只是同时打开了两个?!

同上,谢谢;
Seven Han:
回复 user5195598:
无法在CCS的同一个Graph上显示两个图形,Dual Time的使用如上所说。
同上,谢谢;
user5195598:
回复 Seven Han:
谢谢
 TI中文支持网


